The End
I will no longer be updating this site but feel free to navigate over to vicmora.com where I will be updating my new blog. Thanks!
Quick Take On The Markets & Watchlist
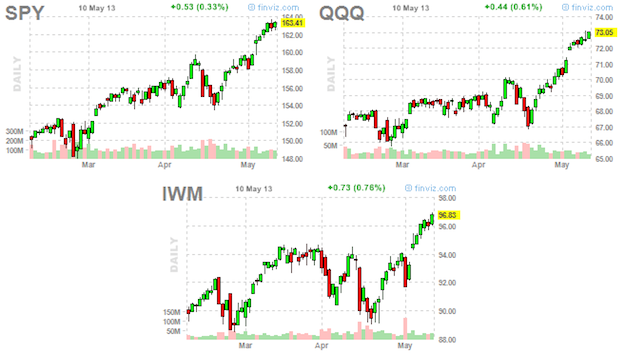
SPY QQQ IWM 5-11-13
The S&P 500 (SPY) was up 1.26% this week while the Nasdaq 100 (QQQ) and Russell 2000 (IWM) were up 1.29% and 2.18% respectively. The markets keep getting higher, with or without you.
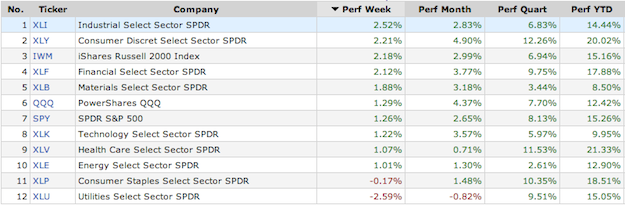
Sectors 5-11-13
This week was another rotation out of safe sectors to riskier sectors. Industrials (XLI) and consumer staples (XLY) led to the upside while consumer staples (XLP) and utilities (XLU) underperformed. So far, the market strength is supported and markets are displaying risk seeking behavior.
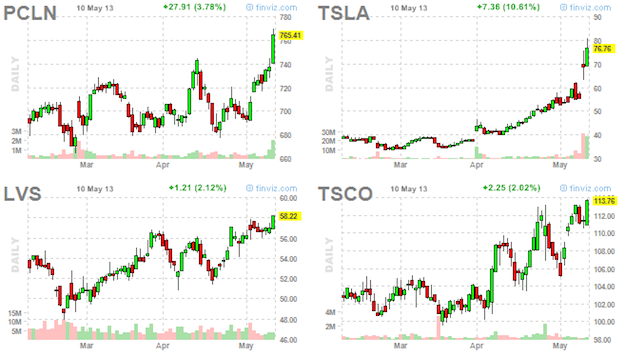
PCLN TSLA LVS TSCO 5-11-13
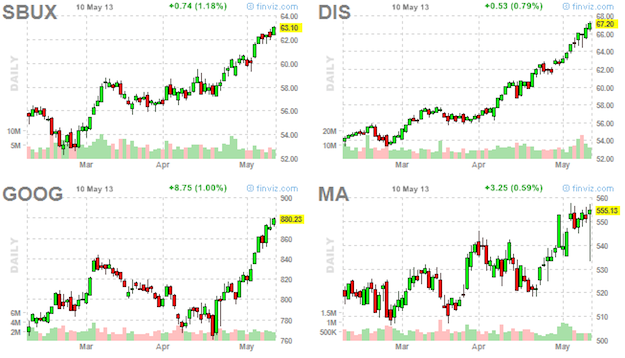
SBUX DIS GOOG MA 5-11-13
Ultimately, the action of individual stocks is what matters most. In my opinion, above is a list of market leading stocks that are poised to continue higher. A ton more stocks have setup this week but these are the ones I like the best. I’m looking at short put spreads (credit spreads) or long call vertical spreads on these stocks. Of course, I’m waiting to enter these on breakouts.
I’m not ruling out a potential pullback since we’ve come so far, however, I’m not in the business of predicting because I simply do not have the tools and resources to do so. Doing what is working right now has worked well for me. Should the pullback come, I have my stops set and normally hedge with short weekly call spreads or long put spreads on the S&P 500 (SPY).
Markets Keep Exploding And Options Watchlist
SPY QQQ IWM 5-5-13
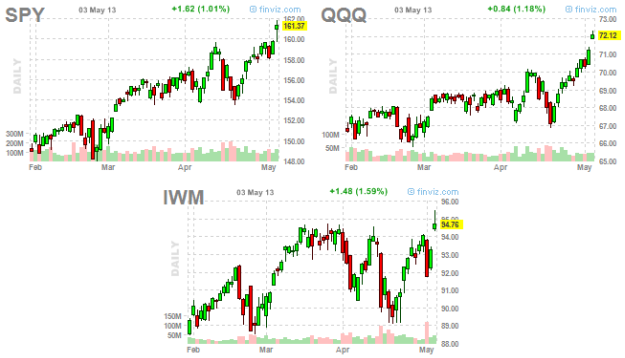
The markets were up a reasonable amount this week and broke-out to higher prices on Friday: S&P 500 (SPY) +1.98%, Nasdaq 100 (QQQ) +3.67%, Russell 2000 (IWM) +2.00%. Let’s take a look at what sectors led in order to see if the move higher looks healthy or not. Generally, we want to see a rotation into higher risk sectors on moves higher.
Sectors 5-5-13
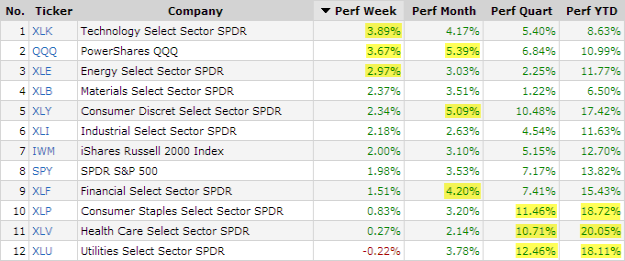
This week, technology (XLK and QQQ) and energy (XLE) led the markets higher indicating a rotation to riskier sectors. On the picture above, the highlights are the top 3 performing sectors for each time period. For the quarter, healthcare (XLV), consumer staples (XLP), and utilities (XLU) have led but were the laggers this week, another indication of increased risk appetite.
MELI ADBE SBUX DIS WYNN GOOG V
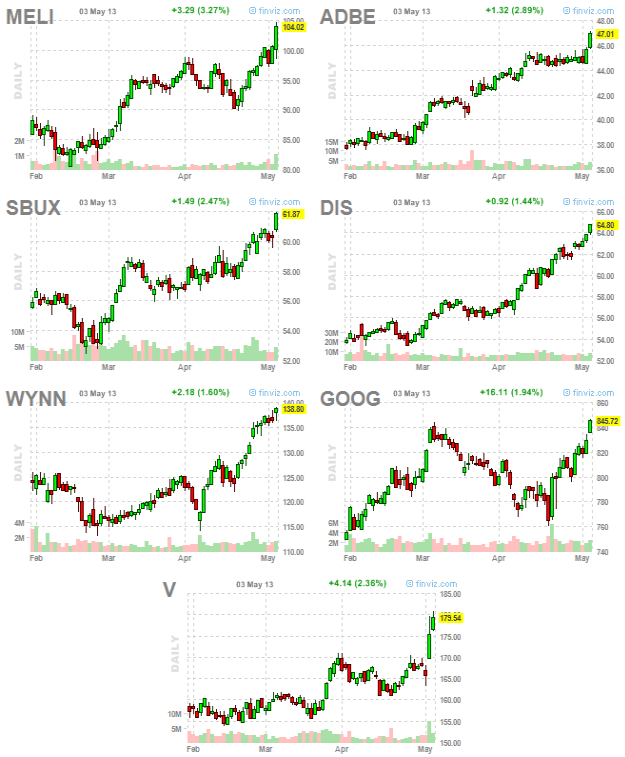
This last week has produced the most setups that I have seen in recent weeks. Now, you can take this as a contrarian and say, “it’s too bullish,” or you can take it as healthy. Personally, I’ll take it as health. Also, I am not dismissing the fact that we could correct this coming week but it will simply create better entries. All of the above tickers look great for higher prices, I just need to cherry pick the best ones this coming week!
Earnings 5-5-13
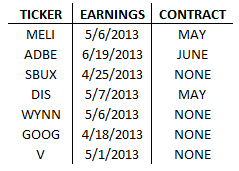
Lastly, I focus on selling put credit spreads or buying call vertical spreads on these tickers so being aware of which options contract months are being affected by earnings is key. Luckily, as seen on the table to the left, most of these names have already reported or will report this week. Another thing that has been working during these bullish times is selling weekly put credit spreads, returning about 5% weekly on margin.
Great blog! I have been trading butterflies lately on individual stock names and trying to learn about them. I’m fairly new to options and love the added dimension of volatility. You mention in your blog that skew is important for flies since you’re short the body and long the wings. So a flat skew would benefit a fly. I used ATM vol to price the wings of a fly using various strikes out to see what flat vol price would be and how far off it is from current price. Then I just keep updating them in excel. Thing is it seems to be fairly consistent and don’t vary too much.
My question to you is, do you think that skew flatness offers an edge? I mean, how much does that translate into the price of the fly when it reverts back to the norm? Is it enough? I check on high price stuff like AAPL. Seems like at most 10-15 cents… which isn’t much on its own.
Also, how do you know what is flat and what is steep? I noticed you look at the vol/50 delta and vol/25 delta for example and those figures seem to be consistent across various asset classes. Is that how?
My Response:
Thanks for reading!
Skew flatness does offer a few points edge. I read the following in Volatility Trading by Euan Sinclair (Chapter 3):
One way of determining the relative importance of different types of movement is principal component analysis (PCA). This is a mathematical technique used to reduce the dimensionality of data sets. For an introduction refer to Alexander (2001a). Derman and Kamal (1997) applied PCA to S&P 500 and Nikkei options. They examined the daily change in the volatility surface where it was parameterized by delta and time to maturity. Skiadopoulos, Hodges, and Clelow (2000) applied PCA to changes of S&P 500 implied volatilities for given maturity buckets, using both strike and moneyness metrics. Alexander (2001b) applied PCA to daily changes in the deviations of strike volatilities from the at-the-money (ATM) volatilities.
Alexander’s work is most directly useful to us. She showed that a parallel shift of the implied volatility smile accounted for between 65 and 80 percent of the total variation of volatility. A tilting of the curve explained a further 5 to 15 percent of the variation, and the curvature component explained about another 5 percent of the changes. So the most important thing to understand is the dynamics of the overall level of volatility, followed by the slope of the curve.
So from this excerpt, movements in overall implied volatility account for 65 – 80% of the variation in IV while skew accounts for 10% – 20% (slope & curvature). I have found that most of the time, skews are normal to flat but it is still important to be aware of the environment.
In order to see what is flat and what is steep, I download historical data from a Bloomberg terminal of 10 delta puts/calls and ATM puts/calls. I divide 10 delta put/50 delta put & 10 delta call/50 delta call. I check those numbers against historical averages to see if it is historically steep, average, or flat. Check this post out for a detailed explanation: SPX Put and Call Implied Volatility Skew In Perspective.
I hope I answered your questions, if not, let me know!
What Led The Market This Week? (And Watchlist)
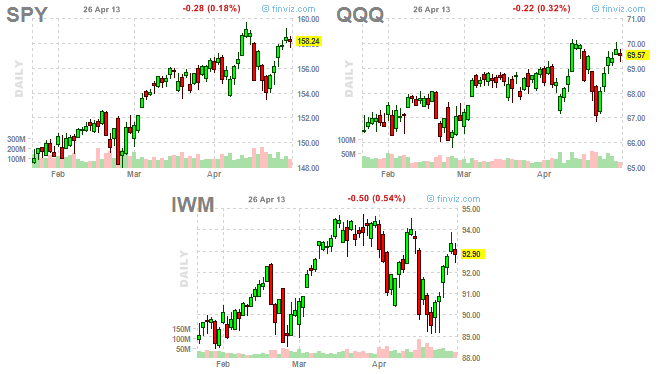
SPY QQQ IWM 4-26-13
As seen above, the markets were very resilient this week. With the swift movements this market is making, it’s probably best to remain nimble and keep position sizes small. Let’s take a look at what sectors led the market in order to gauge overall sentiment.
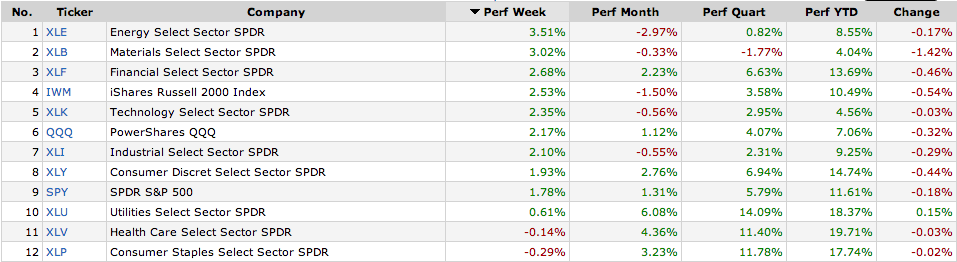
Sector Performance 4-26-13
Energy, materials, and financials led while utilities, health care, consumer staples trailed this week. Last week, energy was the worst performing sector and consumer staples was one of the best performing. This constant rotation is confusing and the best anybody can do is try and ride the waves using smaller size or stay out until there is more clarity.
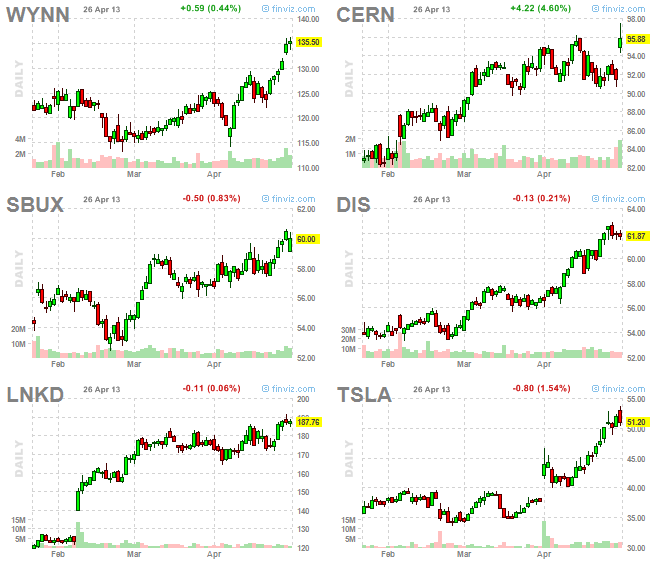
WYNN SBUX TSLA DIS LNKD CERN 4-26-13
The stocks above are holding up well in good and bad times. I’m looking at long call verticals or short put credit spreads on volume-backed breakouts. We’re in the middle of earnings season and I am never in a position through earnings so you’ll find eps dates below, provided by Finviz.

Earnings 4-23-13
Wynn (WYNN), Cerner (CERN), and Starbucks (SBUX) reported this week already while Disney (DIS), LinkeIn (LNKD), and Tesla (TSLA) are still affected by earnings.
Good luck!
Defensive Sectors Leading The Market & Watchlist

SPY QQQ IWM 4-21-13
The S&P 500 was down -2.09% this week while the Nasdaq 100 was down -2.65% and the Russell 2000 -3.24%. Also, volatility started to pick-up, raising concerns for this run. Let’s see what held up well and what sold off for a better indication of the overall health of the markets.
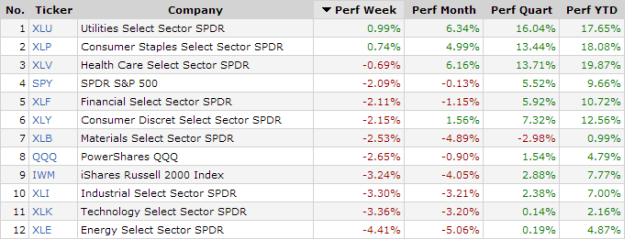
Looks like utilities and consumer staples performed well this week while energy and technology sold off, an indication of rotation into safer sectors. Overall, these are not healthy signs as defensive sectors are leading and volatility is rising.
Are any stocks holding up well? A strong stock in bad times will be even stronger in good times.
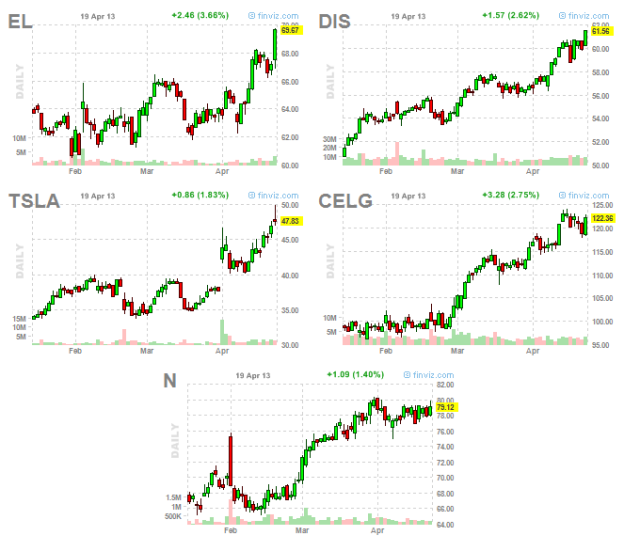
EL DIS TSLA CELG N 4-21-13
Estee Lauder (EL), Walt Disney (DIS), Tesla (TSLA), Celgene (CELG), and NetSuite (N) have broken-out higher in the last week or are setting up to do so. These are the types of stocks I’d like to get long in opportune times.
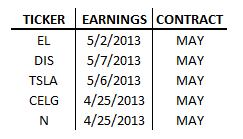
Celgene (CELG) and NetSuite (N) have earnings announcements this week so I probably will not be playing those until after.
Good luck!
Breaking Down This Week’s Winners & Watchlist For Next Week

SPY QQQ IWM
The S&P 500 was up 2.14% this week and has made new all-time highs. Let’s take a look at what sectors led the markets higher:

Sector Performance
Energy, financials, and health care led higher while utilities, tech, and consumer staples were relatively weak which indicates a rotation into risky sectors, a positive thing for the markets.
With that said, these stocks performed well this week and are on my watchlist for potential pullbacks:

WYNN DIS CELG PNRA
Now, these stocks are some that are also on my watchlist for next week. I’ll look for breakouts higher or sustained pullbacks to get in via short put vertical spreads (credit spreads) or long call vertical spreads.
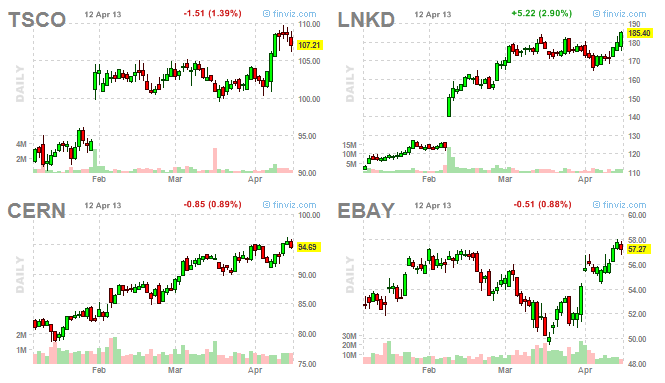
TSCO LNKD CERN EBAY
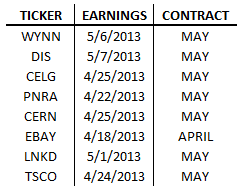
Earnings announcements have a significant effect on stocks and options so its important to be aware of when each company announces. To the left you can see the earnings dates provided by Finviz and the options contract month that is affected.
Good luck trading!
Follow @victormora for intraday commentary!
//
What Sectors Are Leading The Market?
J.C. Parets over at All Star Charts breaks down the U.S. stock market by underlying sectors in order to see what is leading the market higher or lower. With this information, we can see if there is a rotation in or out of defensive sectors. Parets asks a very important question:
Who is driving it [the market] and who is holding it back?
and offers this valuable tip:
I find that it’s a helpful exercise to look at the components of the market and see how they’re faring against each other and also against the broader average.
Read the full post to see how the sectors are behaving: A Look Inside The US Stock Market.
Market Strength and My Watchlist
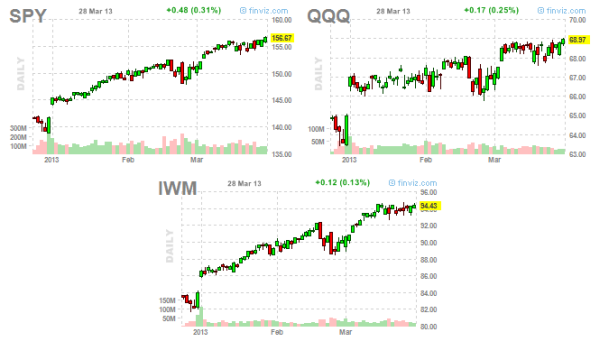
SPY QQQ IWM Daily Price Chart
The markets have been very strong over the last quarter as seen in the daily price charts of the S&P 500, Nasdaq 100, and Russell 2000 represented by respective their ETFs, SPY, QQQ, and IWM. All three indexes look to be headed higher as they consolidate through time instead of a price correction.
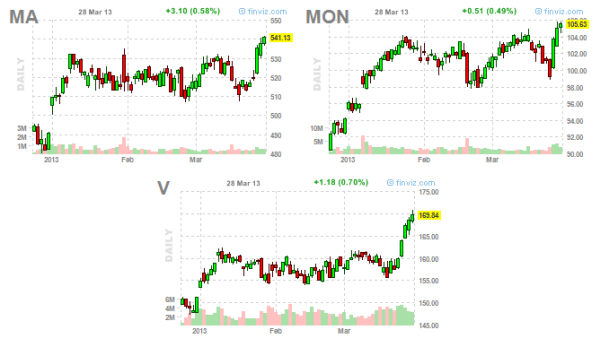
MA MON V Daily Price Chart
Mastercard (MA), Monsanto (MON), and Visa (V) have been market leaders throughout this bullish run. In fact, all three stocks have broken-out in the last week. Entering bull put spreads (sell put verticals/credit spreads) is what I’ll look to be doing on a pullback.
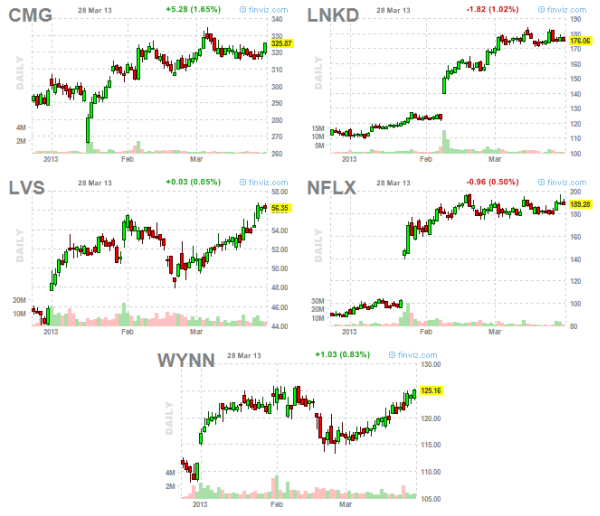
CMG LNKD LVS NFLX WYNN Daily Price Chart
Chipotle Mexican Grill (CMG), LinkedIn (LNKD), Las Vegas Sands (LVS), Netflix (NFLX), and Wynn Resorts (WYNN) are all potential break-outs. On a strong volume-backed breakout, I’ll also look to enter bull put spreads (sell put verticals/credit spreads).
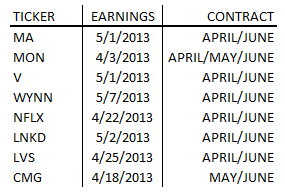
Using the earnings dates provides by Thinkorswim to the left, all of the mentioned stocks have earnings influencing the April or May contracts. The table also lists the contract months I will be looking at if I decide to take any of these trades.
Stay tuned.
Follow @victormora for intraday commentary & for accountability of my entries/exits.
Disclosure: In MA April bull put spreads & LNKD April bull put spreads
